New Harvest Finance & Analytics
A personal project demonstrating a complete finance data pipeline — from accounting setup through custom API integration to Power BI analytics.
Scroll to explore each stage of the pipeline.
Data Flow
↺ Fully automated
Bridge App schedule
Runs on a set schedule — pulls the latest data from Xero and the Ops App automatically.
Power BI dataset refresh
Power BI picks up the new data and refreshes the underlying dataset.
Dashboards update
All reports reflect current data with no manual step needed.
✦ Bridge App built from scratch
Xero Accounting Setup
The data foundation
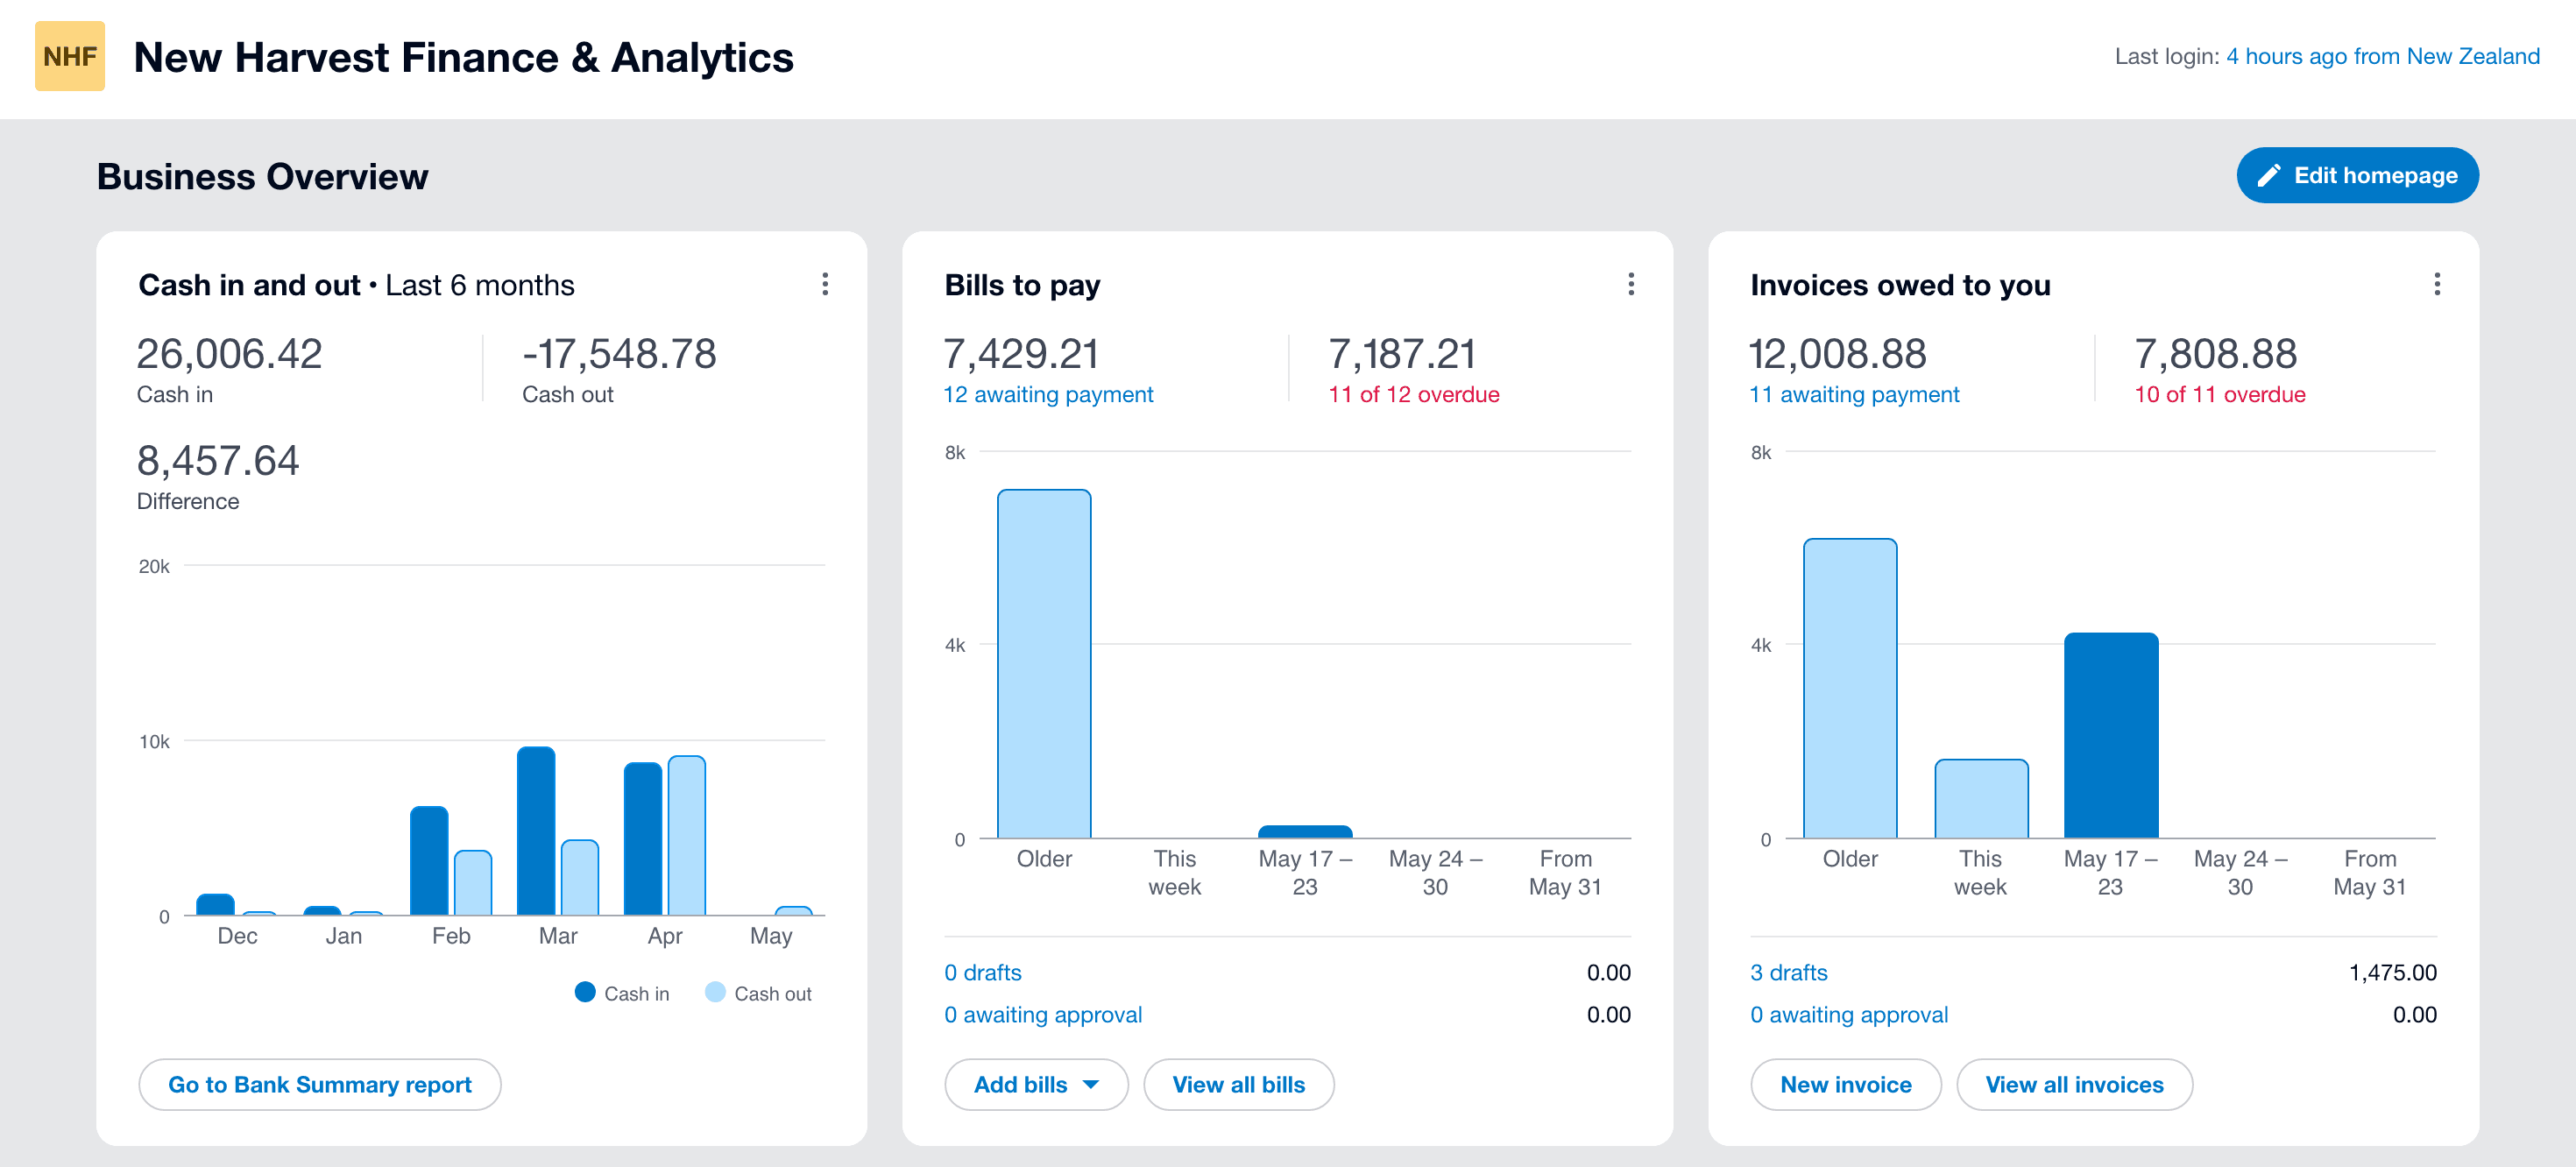
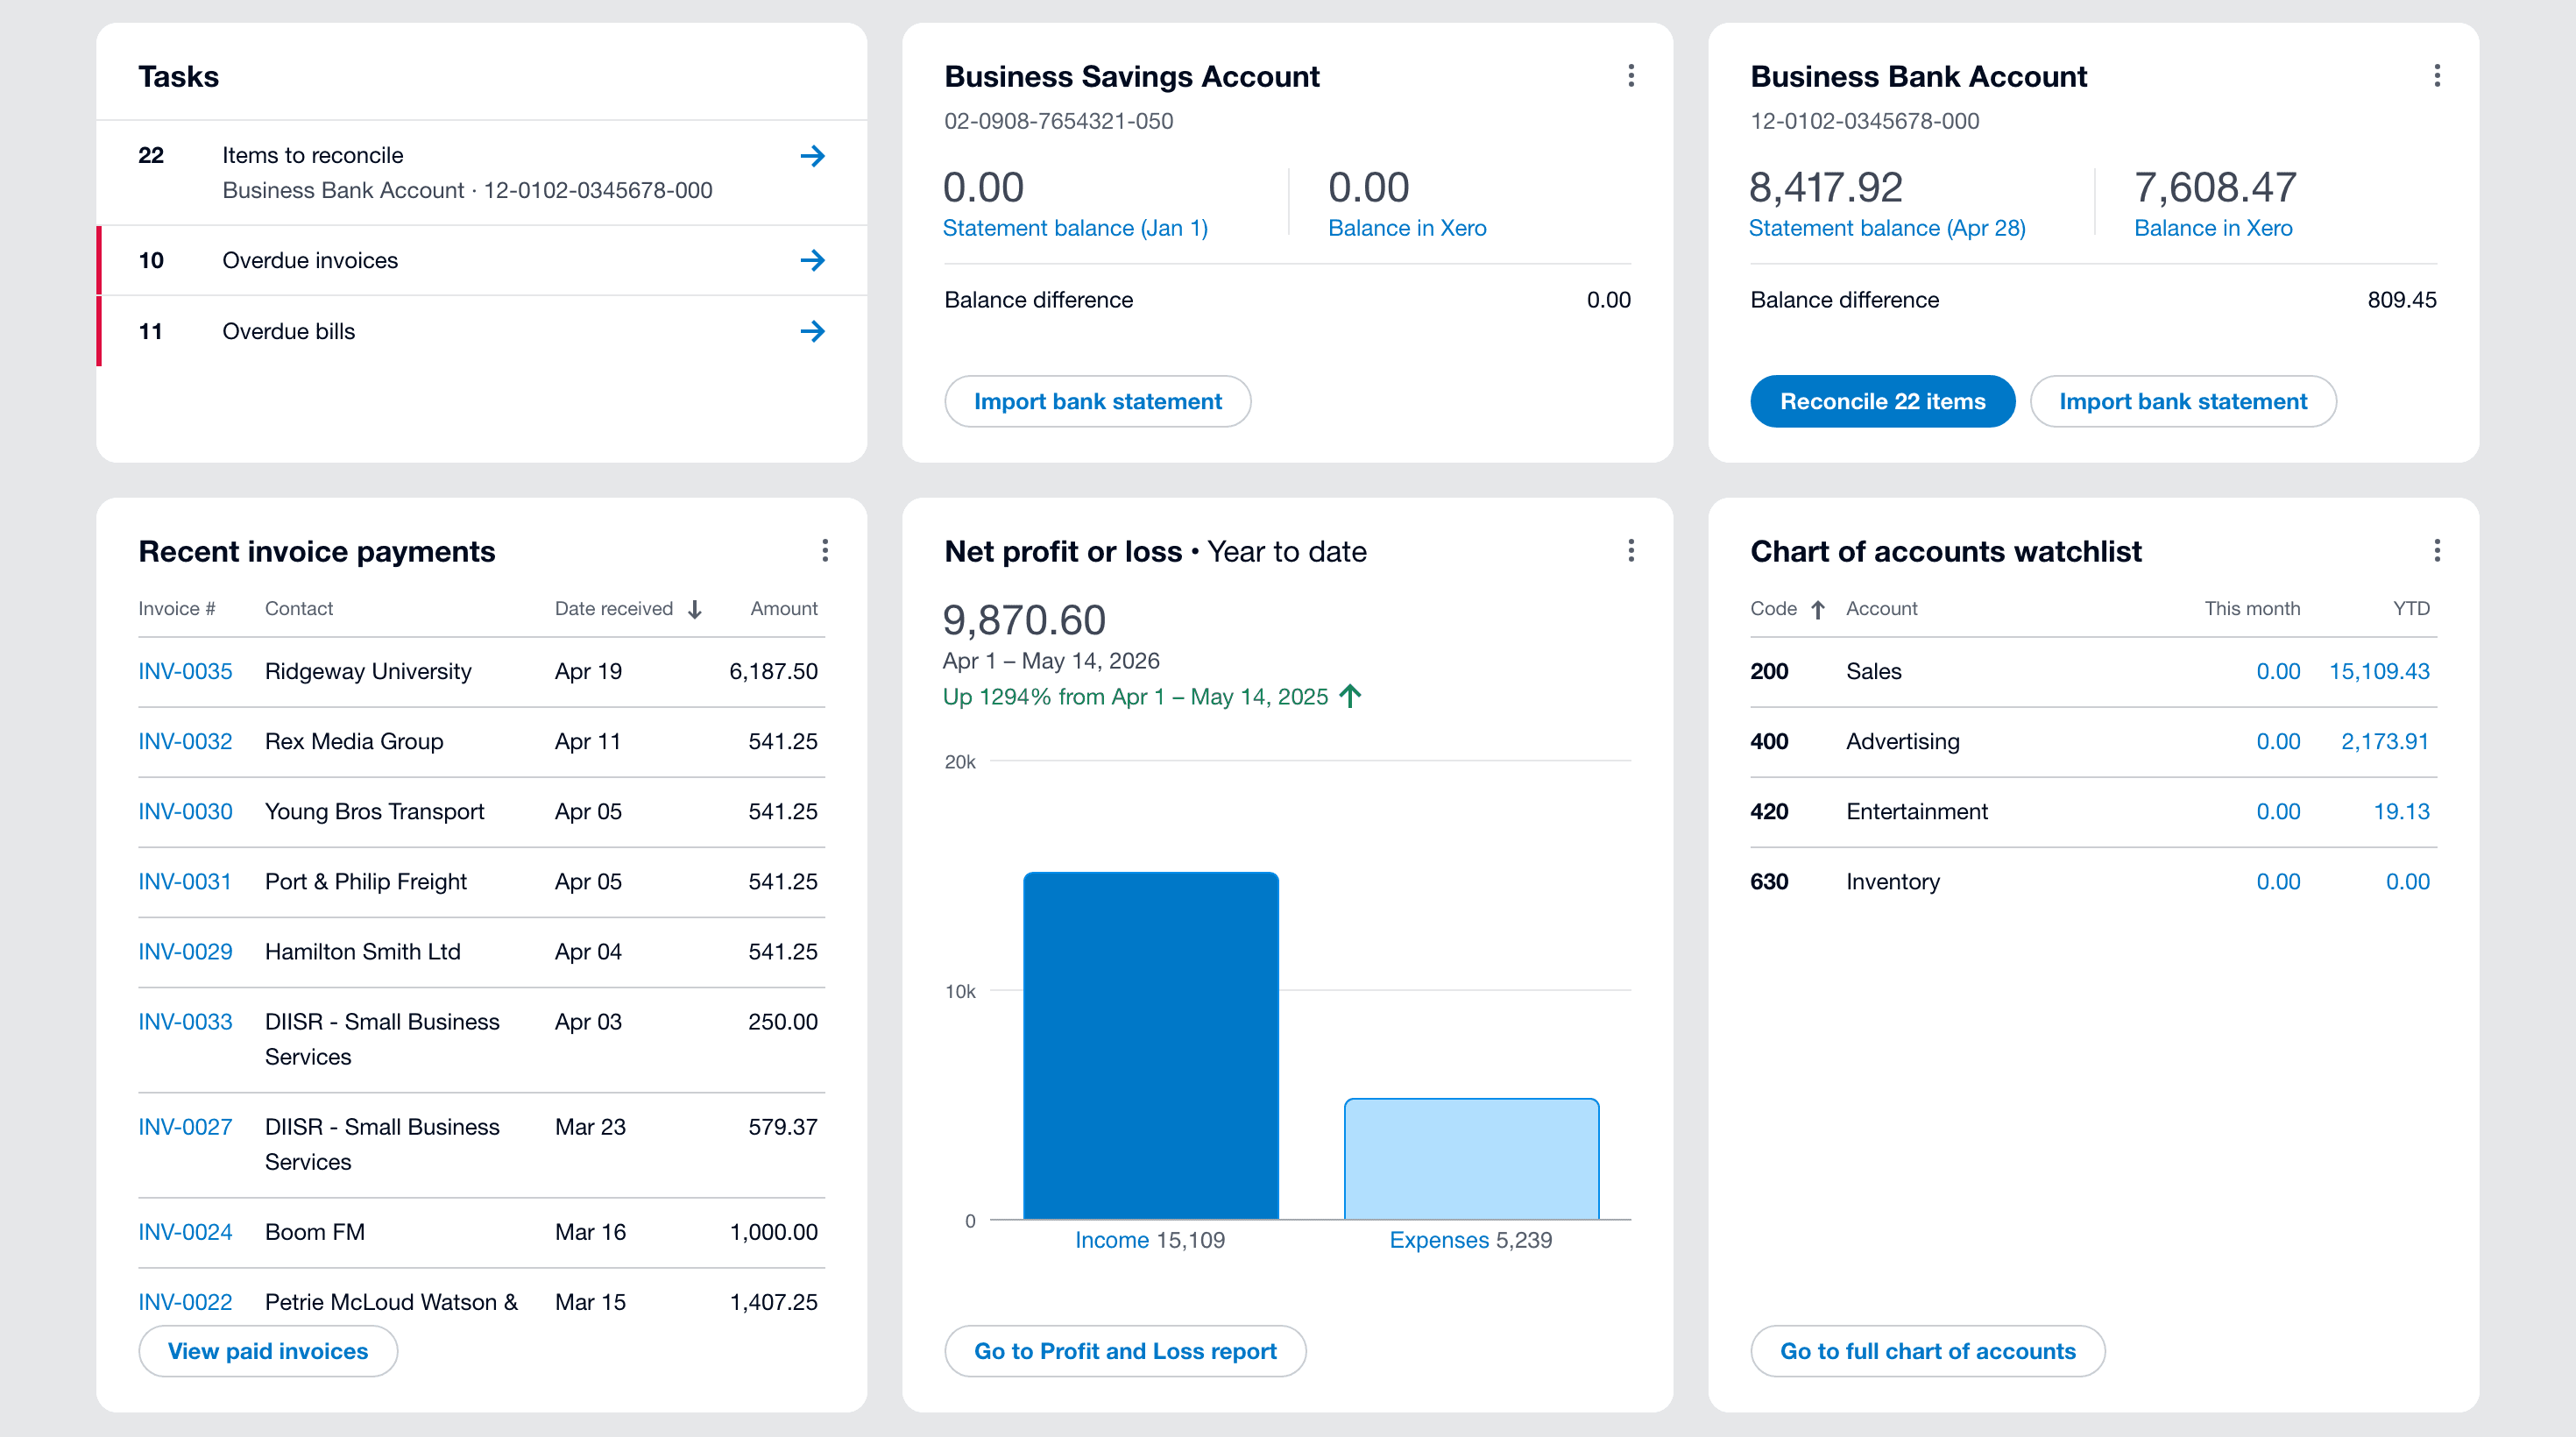
Starting from scratch: a chart of accounts designed for meaningful reporting (not just compliance), tracking categories aligned to the business's cost structure, bank feeds configured, and a clean cutover from manual records. This is the foundation — the structure set up here shapes every report and analysis that follows.
Decisions made at this stage — which categories to track, how to split revenue lines, what cost centres matter — compound in value over time. Done right, the accounting system becomes a genuine source of business insight rather than a compliance obligation.
Xero Bridge App
Custom builtCustom API integration — built from scratch
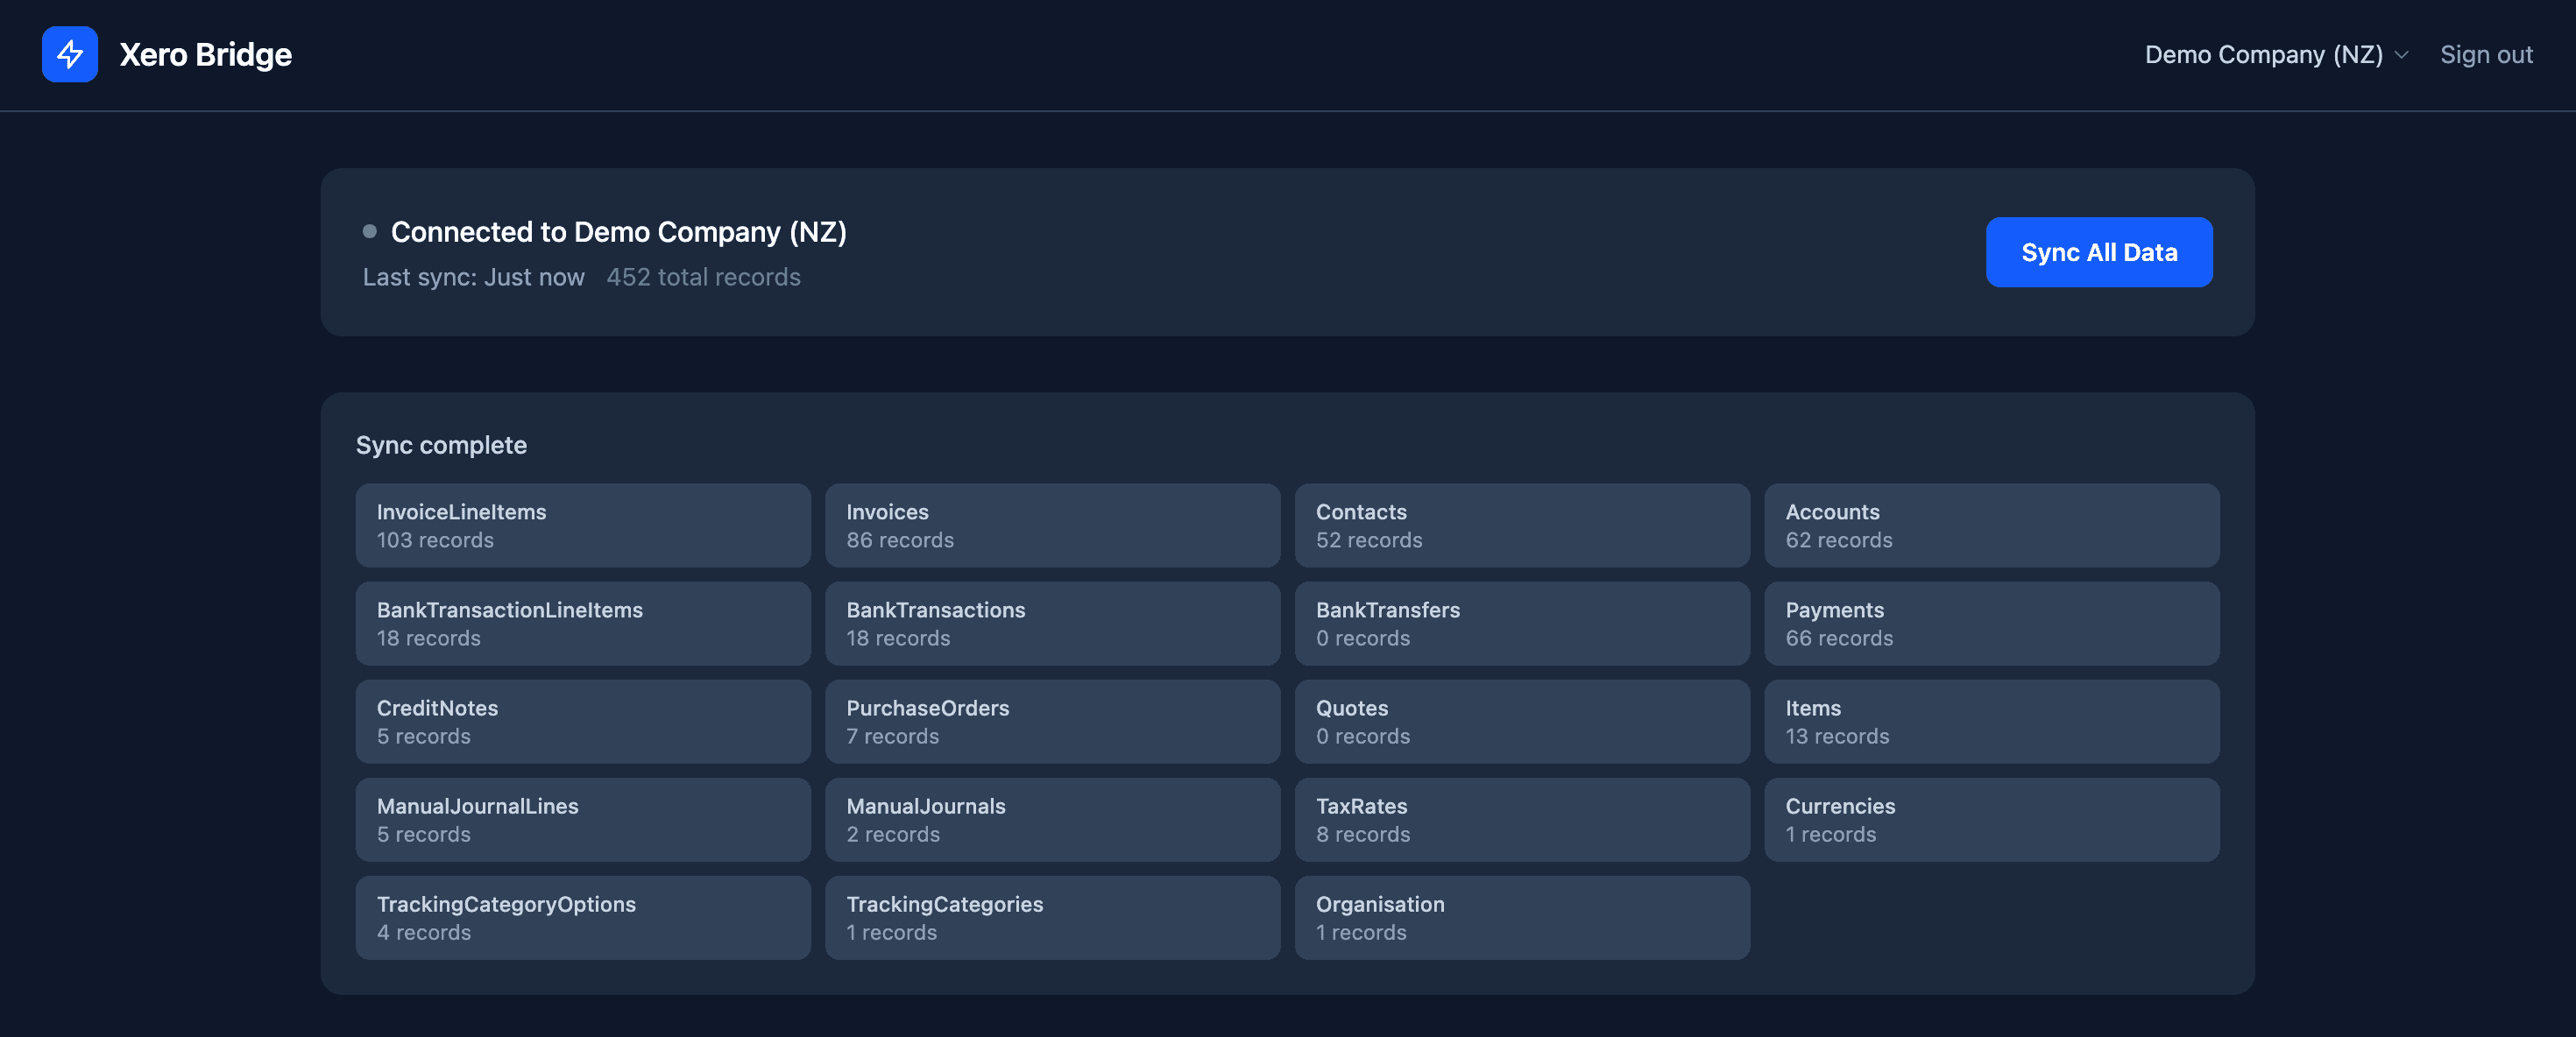
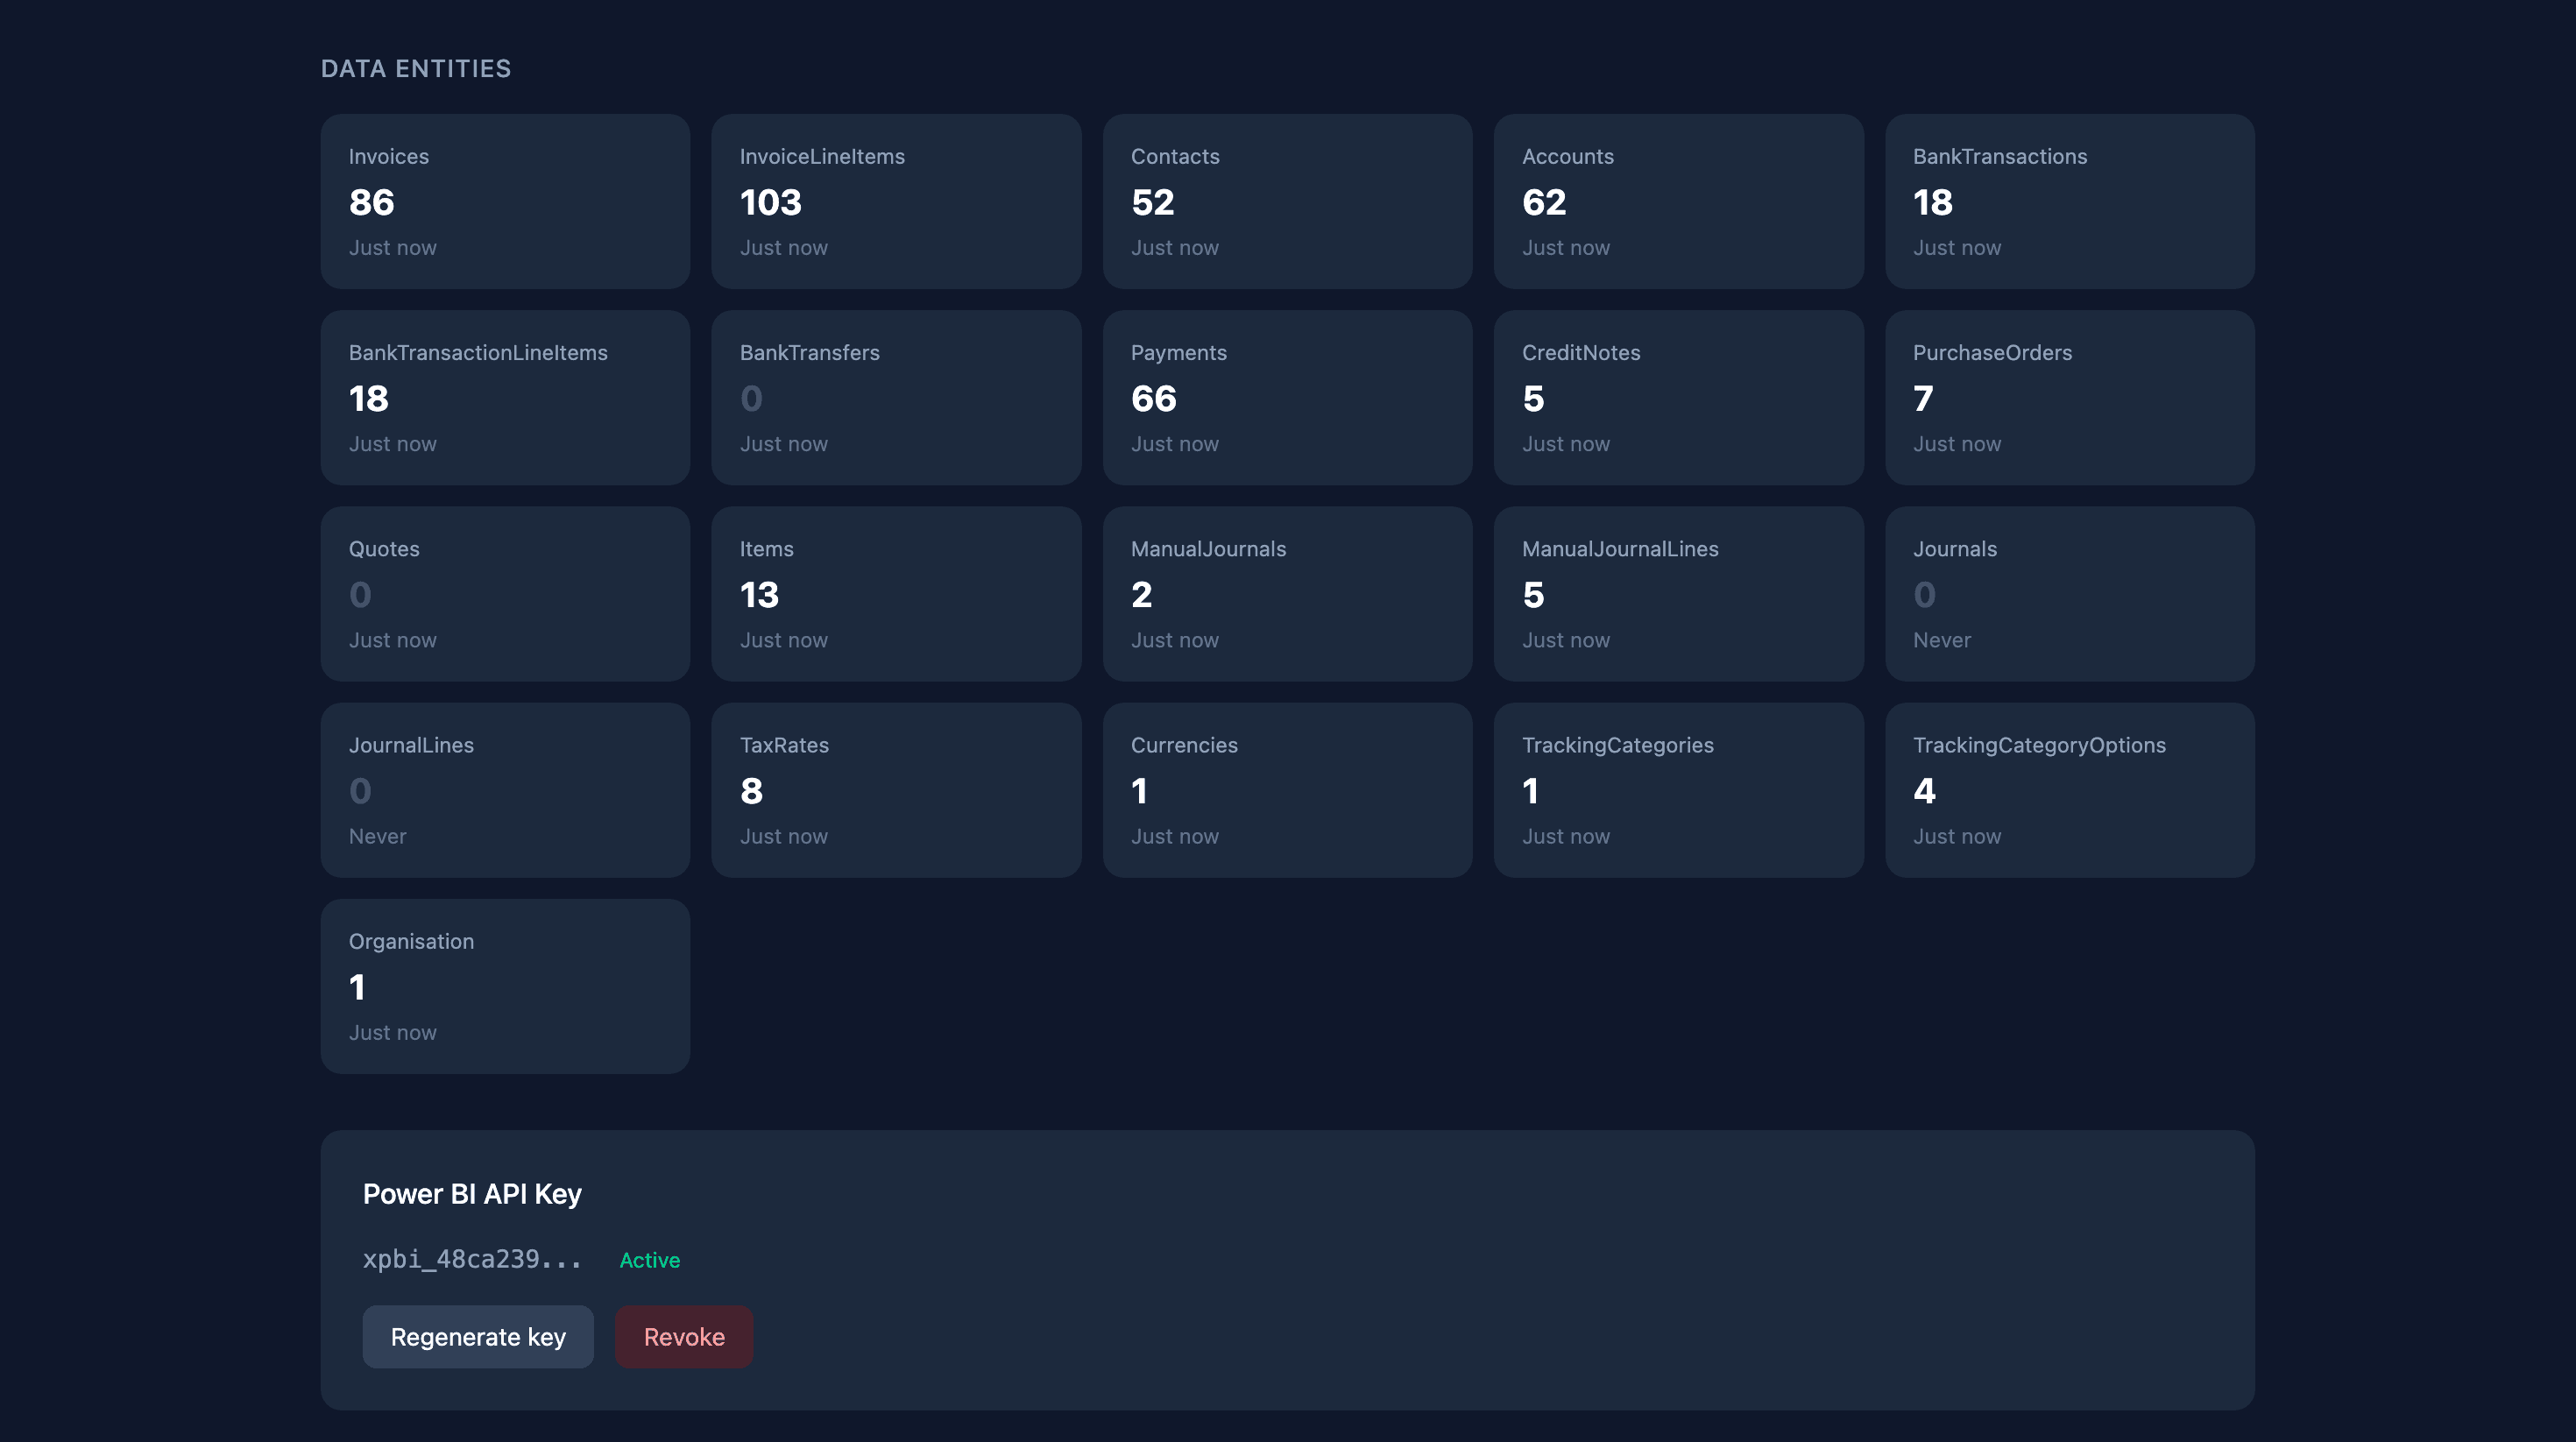
A Python application that connects to the Xero API via OAuth 2.0, pulls financial data (invoices, bills, journal entries, contacts), transforms and normalises it, and makes it available to Power BI — without needing a commercial connector. Runs on a schedule so Power BI always has current data without any manual export or intervention.
Commercial Xero→Power BI connectors exist but cost money, impose constraints on data shape, and are a black box. Building the bridge myself meant I could pull exactly the fields needed, flatten nested objects for easy querying, and control the refresh schedule. When the Bridge App runs, it triggers the Power BI dataset refresh — closing the automation loop.
Operations App
Hours & project tracking
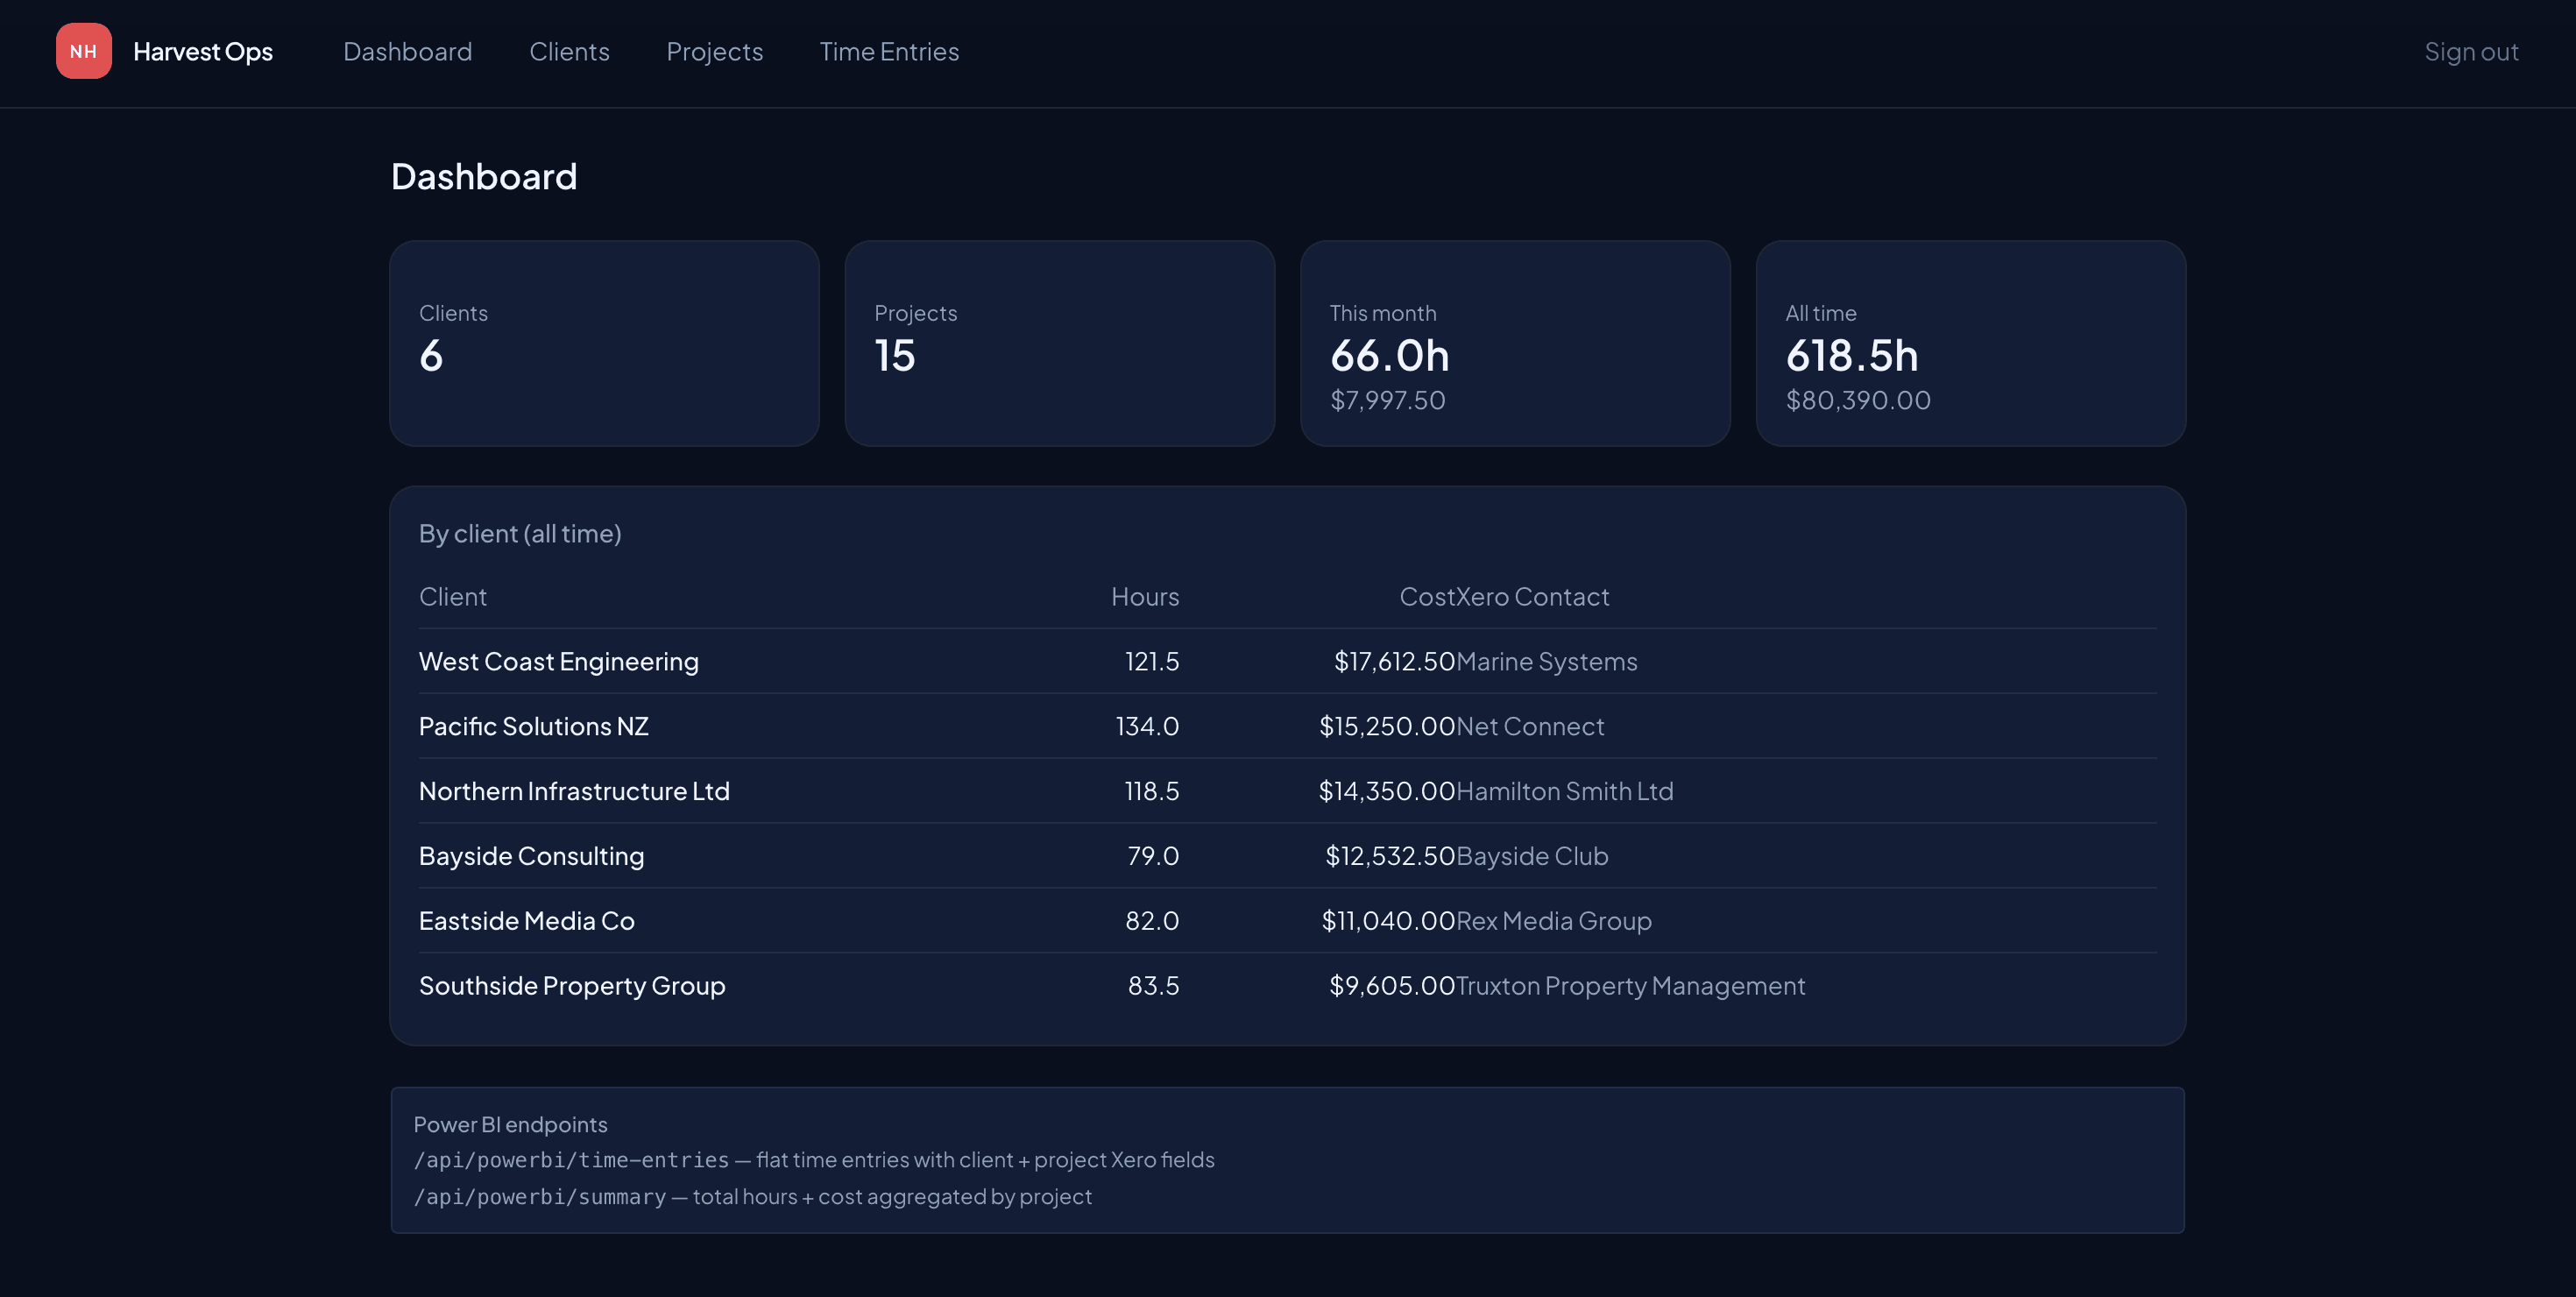
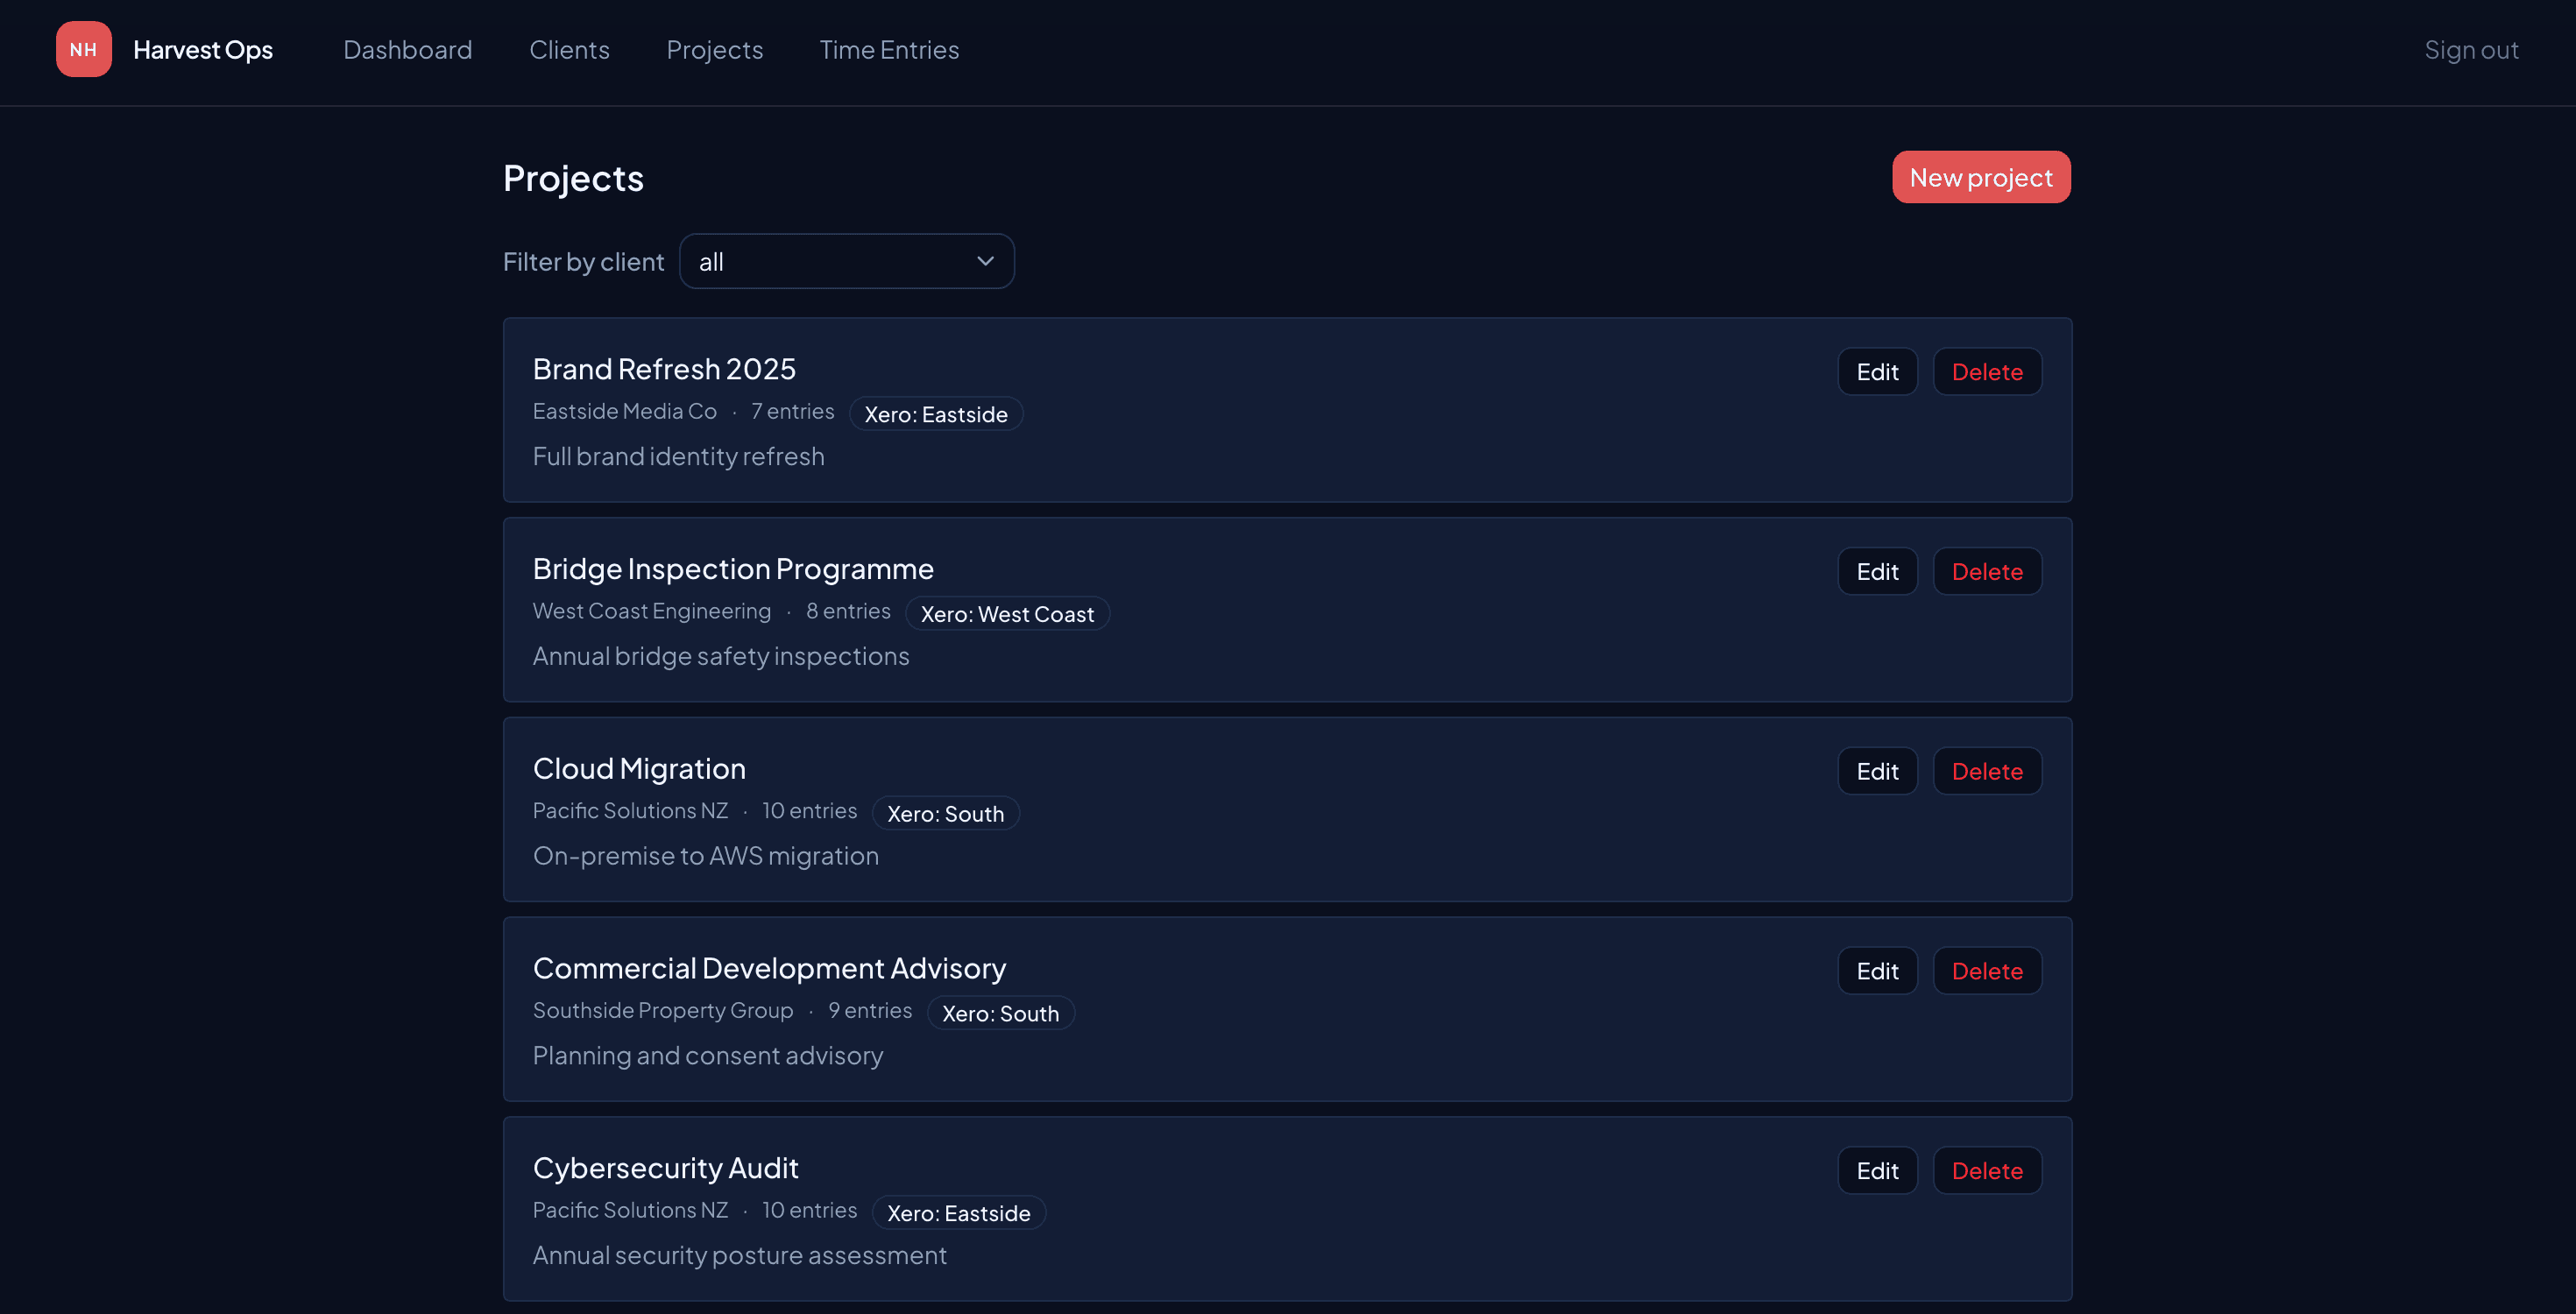
A web application for logging hours by project and team member — capturing the operational data that accounting software alone can't see. Tracks time entries, project codes, and billing rates so the analytics layer can calculate effective hourly rates, project margins, and utilisation without manual exports.
The key insight here is that financial data and operational data need to be aligned to the same project and client identifiers. The ops app is designed from the start to share those keys with Xero — making the join in Power BI trivial rather than a data-wrangling exercise.
Power BI Analytics
Financial + operational data, side by side
Dashboards that combine Xero financial data (via the Bridge App) and Ops App hours data in a single model. Key metrics: effective hourly rate by client, revenue vs cost by project, utilisation rates, and cash flow — all updated automatically as both data sources refresh.
The combined model is what makes the analysis interesting. Seeing revenue per project alongside hours logged per project — in the same view — surfaces things that neither dataset would show alone: which projects are actually profitable, which clients consume disproportionate time, and where the business is growing efficiently.
Embed your Power BI report or add a dashboard screenshot
What this demonstrates
New Harvest Finance & Analytics is a fictional company — a framing device for a portfolio project that shows the full stack of a modern finance analytics setup. Rather than presenting skills in isolation, it shows how they connect end to end: from getting data into an accounting system, through building the integration layer, to surfacing it in a reporting tool.
The most interesting piece is the Bridge App: rather than using an off-the-shelf connector, I built the Xero→Power BI integration from scratch. It demonstrates API integration, OAuth 2.0 authentication, data transformation, and scheduling — all in a practical, real-world context.
The Ops App adds the operational dimension: hours and project data that accounting software doesn't capture, brought together with financial data in Power BI for a combined view of how the business is actually performing.